TresVista | Leading Financial Service Provider
Request and Guidelines Provided
-
Client: Private Equity Secondaries firm
-
Create a dashboard for the fundraising process of the client’s PE funds to track relevant KPIs, targets, and other metrics
-
Leverage data from multiple Big Query tables sourced from different platforms
Final Deliverable and Value-add
-
Created a tailored visualization solution using Tableau for scalability and ease of use
-
Allowed users to drill down into specific fund-wise data to gain deeper insights and understand factors driving fundraising success
-
Seamlessly integrated live data sources to provide up-to-date information on fundraising progress to the stakeholders
Methodology
-
Designed data warehouse architecture to integrate and store data from multiple sources (client’s CRM system and other data repositories) in a structured format for analysis and reporting in Google Cloud Storage
-
Extracted and consolidated data from multiple Big Query tables in the form of views and created customized SQL queries for transforming data using Big Query functions
-
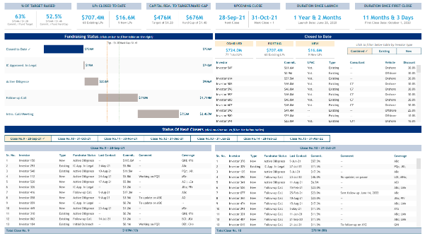
Created an intuitive and visually appealing dashboard with real-time data refreshes to ensure up-to-date insights for the stakeholders
-
Highlighted important metrics in the dashboard such as Total Capital Raised, Meetings, Timelines, Conversion Rate etc.
Snapshots of the Output